My data-driven investment toolkit
This is the first post in a series about data-driven investing.
In this post I describe a software toolkit called hetty,
named after Hetty Green, an American investor
and contemporary of other famous investors like Andrew Carnegie, Henry Ford, John R. Rockefeller and J.P. Morgan.
Because I mostly follow a value investing philosophy,
hetty consists of a set of scripts for gathering, analyzing and monitoring fundamental financial data.
Although I will not publicly share the scripts,
I hope the description of the problems I tried to solve might give you some inspiration for implementing your own investing toolkits.
This post will not contain information about specific companies, or recommendations for securities. I'm not a licensed investment banker, which means I'm not qualified to give Serious Advice about these matters. I also believe it's not necessary to recommend any specific stocks. As Warren Buffett pointed out in his essay about coin-flipping orangutans: the most succesful investors in the world pick vastly different stocks -- there are many valid strategies for investing, and there is not one strategy that fits all investors. Instead, do your own research and invest in what you know.
Stock prices
The first script I wrote was the one that I still use most often: it scrapes the current price of a specific stock, currency, fund or commodity. I say 'current price', but generally the price is delayed by 15 minutes. Of course I can get this information from my broker, with the added benefit of realtime price updates. However, for a value investor, knowing the "realtime" price for a stock is not essential at all. If a stock is a good deal at €5,30, it's probably also a good deal at €5,36. I'm not a high-frequency trader. If I need to buy a stock now for my investment strategy to work, it's probably not a very good strategy to begin with.
Getting stock prices with a script has two big advantages.
The first advantage is that I can get prices in bulk. In the web interface provided by my broker, I can get one stock price per search. Getting a list of current prices, for say, 10, 100 or 1000 stocks would take too much time (and clicks and typing). When you have a script, getting prices for 600 companies is as much hassle as getting the price for one company.
The second big advantage is that I can spend less time on my broker's platform. The broker's business model is to make money off transaction costs. In other words, it's in the broker's best interest if I buy and and sell as much stocks as possible using their platform -- that's how they make money. Consequently, their platform is engineered to make buying and selling as tempting as possible. Flashing stock prices and bold headlines give users a sense of urgency, and pretty colours and big buttons give the impression of a video game or slot machine. Value investor and writer Guy Spiers called Bloomberg Terminals "the informational equivalent of smoking crack cocaine" -- and that's also how internet brokers design their web interfaces. Banks and their UI designers have made it almost trivial to spend large sums of money in the stock market. Good for brokers, but generally not for investors.
Alerts
Once I could collect stock prices, I built a simple alerting system that sends me an email whenever a stock has reached a certain price.
I do a lot of research to find companies that I would like to invest in. However, sometimes the stock price is on the high side. In that case, I set an alert for a lower stock price, so I get an email whenever the stock price has reached a point where buying that company is a good deal according to my investing strategy.
If I already own a stock, I can use alerts to notify me of a pre-determined sell-condition. For example, if the company is an asset play, I can set the net asset value per share as the target share price.
I imagine many investors will find this useful functionality. You can set a target price for your favorite stocks and walk away, instead of staring at your favorite stock quote website for hours on end. I was really surprised that my broker does not offer anything like this -- but maybe bankers reserve this kind of functionality for their premium clients?
Monthly overview
Generally, I buy stock once a month, for a fixed amount of money. (This is called Dollar Cost Averaging, even though I trade in euros.) I do this for three reasons:
- Investing is a form of saving (for me), so setting a fixed amount each month means I won't invest too little.
- Investing is a hobby, so setting a fixed amount means I won't spend more money than I planned.
- I want to mitigate timing risk: if I would invest all my money in one go, I would risk losing a lot of money if that moment turns out to be a peak (high point, local optimum) in market history.
Because I buy stocks once a month, I figured it would be useful to get a monthly report on companies and stock prices to help me decide which company I'm going to buy. I like a contrarian investment style, i.e. I like to buy those stocks about which the general public is feeling very pessimistic. These stocks are generally sold for huge discounts to what the underlying company is worth ("fair value").
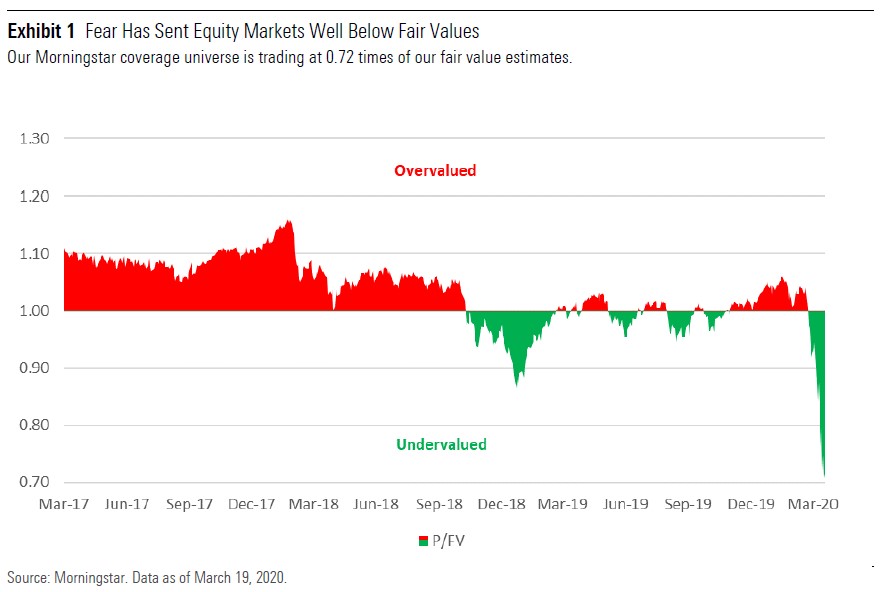
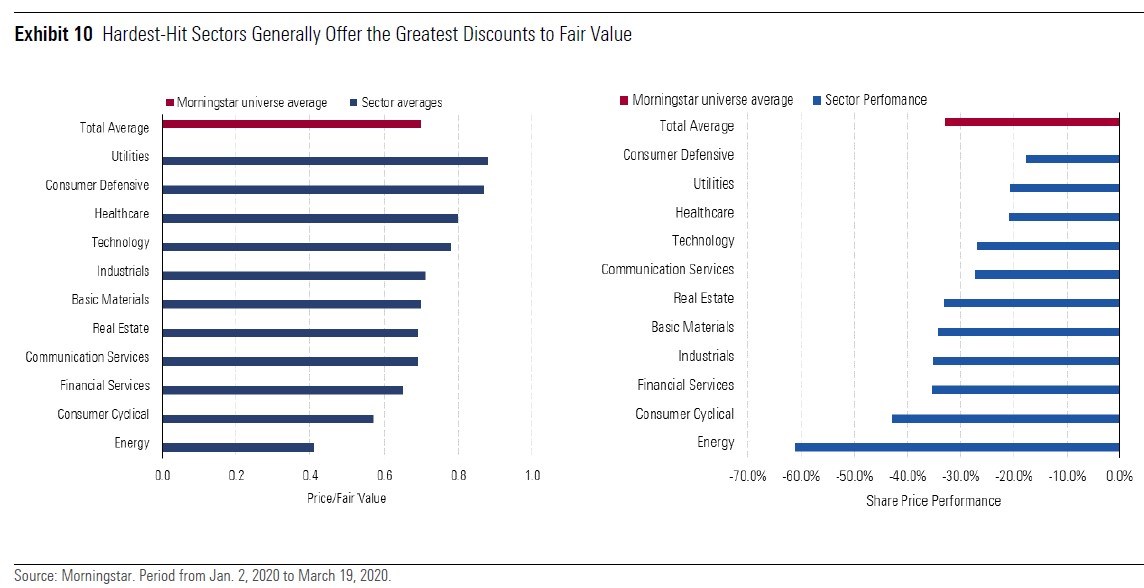
In March 2020, Morningstar.nl posted an article in which they discuss how the corona-virus market crash in March 2020 influenced stock prices across different sectors. If you can't read Dutch, GoogleTranslate can translate the article for you.
One of the graphs from the article shows the price-to-fair-value ratio over time:

You can clearly see a huge dip around March 2020, when almost all companies were selling at a discount.
The other graph shows which sectors were selling at a discount:

Even without a market crash in recent history, there are always a few sectors that are very popular and a few that most people try to avoid. I figured that this information could be used to inspire my stock choices each month.
Unfortunately, Morning Star's Fair Value calculations are only available for paying customers, and even then the metric is not fully transparent. However, I can still use the data visualisation method without using the metric, if I use an alternative metric like price-to-earnings ratio (P/E ratio) instead. I would never make investment decisions based on price-to-earnings ratios alone, but they can be used to gain insight into the popularity of specific sectors.
I wrote a script that, given a list of companies, collects the P/E ratio and sector information, and compiles an overview of the stock market per sector. For each sector, the overview contains the average and median P/E ratio, and a list of companies with a P/E below the average. Generally, I tend to pick one undervalued sector, and then research the companies within those sector to see if I can find an undervalued but high-quality company.
This is a snippet of my monthly overview email for May 2020, which shows the statistics for the Automotive sector. The crazy high average P/E is, of course, because of outlier Tesla (TSLA), which currently has a P/E of 950.
Automotive
---------------------------
Company name                         ticker     quote       P/E
---------------------------------------------------------------
Fiat Chrysler Automobiles NV         FCA:IM      8.02      3.20
Peugeot SA                            UG:FP     13.08      3.65
General Motors Co                     GM:US     22.29      4.62
Volkswagen AG                       VOW3:GR    127.98      5.93
CIE Automotive SA                    CIE:SM     15.99      7.20
Bayerische Motoren Werke AG          BMW:GR     54.00      7.30
Pirelli & C SpA                     PIRC:IM      3.55      8.10
Cie Generale des Etablissement        ML:FP     89.10      9.19
Ford Motor Co                          F:US      5.09      9.72

Sector average P/E Ratio                                 323.69
Company information
My handy monthly overview email created a new problem: which companies should I put in the overview? Or, in investment jargon, which companies make up my investment universe?
Even though I regularly read the Dutch equivalent of the Financial Times, I had a hard time thinking of a broad range of companies to include in my monthly report. US investors can take the S&P 500 as their starting point, but the Dutch "major index", the AEX, only lists 25 companies. Dutch financial news is generally limited to the AEX, AMX and AScX indices, which contain 75 companies in total. This is not really a representative set of companies if you want to extract insights about the global economy.
Instead, I wrote scrapers for two websites related to the European stock market: STOXX and EuroNext. These websites list basic info about all the companies that are part of their indices/exchanges, such as company name, country, sector, market cap and daily trading volumes. I used this information to compile a list of 650 companies from Europe, the UK and US, which is the input for my monthly sector analysis.
Later, I expanded these scrapers to also collect fundamental financial information, such as earnings and asset value. However, so far I've found that the major financial websites do not contain reliable information about European companies at all. Most of these websites get the financial data from American SEC filings, which are all structured in the same way -- which makes them easy to scrape. Unfortunately there is no European (or global) file format standard for reporting financial information. If I want reliable fundamentals for European companies, I either need to get a subscription to a data broker (too expensive, and even those don't always have high-quality data) or I need to read the annual reports and transcribe the data myself -- which is what I'm doing at the moment.
Other stuff
Besides the stuff described above, I've written a framework for trading bots and a framework for backtesting, so that I can try out new investing strategies without actually buying stocks. I've also created a dashboard in Prometheus and Grafana that shows a collection of macro-economic indicators, which I use to gauge investor/consumer/industry sentiment before buying. I'm planning on writing posts about those in the future.
If you want to discuss any of this, please let me know! I don't know many people interested in investing and stock picking in real life, so I'd love to hear from you.